
Page 5 - EnviroVET_PR1_Best_Practice_Toolkit_EN
P. 5
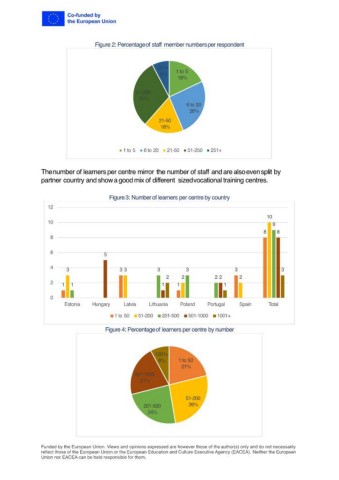
Figure 2: Percentage of staff member numbers per respondent


                                                        251+
                                                         8%    1 to 5
                                                               18%

                                                 51-250
                                                  31%
                                                                   6 to 20
                                                                    26%
                                                         21-50
                                                         18%


                                            1 to 5   6 to 20   21-50   51-250   251+


               The number of learners per centre mirror the number of staff and are also even split by
               partner country and show a good mix of different  sized vocational training centres.


                                       Figure 3: Number of learners per centre by country
                  12
                                                                                               10
                  10                                                                             9
                                                                                              8   8
                   8

                   6                  5

                   4
                        3                  3 3          3         3                 3               3
                                                           2     2           2 2     2
                   2
                       1  1                               1    1                1
                   0
                        Estonia   Hungary   Latvia   Lithuania   Poland   Portugal   Spain     Total

                                         1 to 50   51-200   201-500   501-1000   1001+

                                      Figure 4: Percentage of learners per centre by number


                                                       1001+
                                                         8%     1 to 50
                                                                 21%
                                                501-1000
                                                  21%


                                                                  51-200
                                                   201-500         26%
                                                     24%


               Funded by the European Union. Views and opinions expressed are however those of the author(s) only and do not necessarily
               reflect those of the European Union or the European Education and Culture Executive Agency (EACEA). Neither the European
               Union nor EACEA can be held responsible for them.